Instagram is a photo and video-sharing social networking service founded on the 6th of October in 2010.
It was acquired by Facebook for $1 billion in 2012. Users can post to a permanent feed or to a temporary feed called “stories.”
There is also a live-streaming service. Posts can be shared, liked, or added to collections
Data Collection
Facebook (A.K.A. Meta) has made increasing efforts to stop outsiders from collecting large amounts of information on their sites. Sending too many queries without a break will cause Instagram to ban your IP address for a short amount of time. Proxies can be used to reduce blocking by websites' anti-scraping measures.
The following steps were followed in order to gather data:
- Using an Android phone, you have to download this APK (https://github.com/itsMoji/Instagram_SSL_Pinning). It deals with the latest encryption methods that Insta/FB/Meta use.
- Connect to a proxy (https://www.charlesproxy.com/) on your PC using SSL decryption on the phone.
- Install SSL certification to view SSL data, monitor it.
- Search the hashtag on Instagram on the phone and use an app to automatically scroll (https://play.google.com/store/apps/details?id=jettoast.easyscroll&hl=en_US&gl=US)
- Insta/FB/Meta gets mad and blacklists you after a certain amount of time. Then you have to clear everything, log into a new account, use the "Breakpoint" tool in the proxy to inject the page to the request where you left off.
- Save requests to the API.
After these steps have been completed, and the data has been collected, it is time to process the data. Instagram/Facebook/Meta compresses the JSON data using zstd http://facebook.github.io/zstd/. and before we can begin working with the data, it needs to be decompressed. The following blocks of code do just that.
          !pip3 install zstandard
 import zstandard as zstd
 import json
 file =
          open("/data/example.zst", "rb") #whatever path its in goes here
 data =
          file.read()
 dctx = zstd.ZstdDecompressor()
 decompressed =
          dctx.decompress(data)
 decompressed =
          decompressed.decode('ascii','ignore')
 dataArray =
          json.loads(decompressed)
All files were looped through and combined. It was then cleaned, and graphed for visualization.
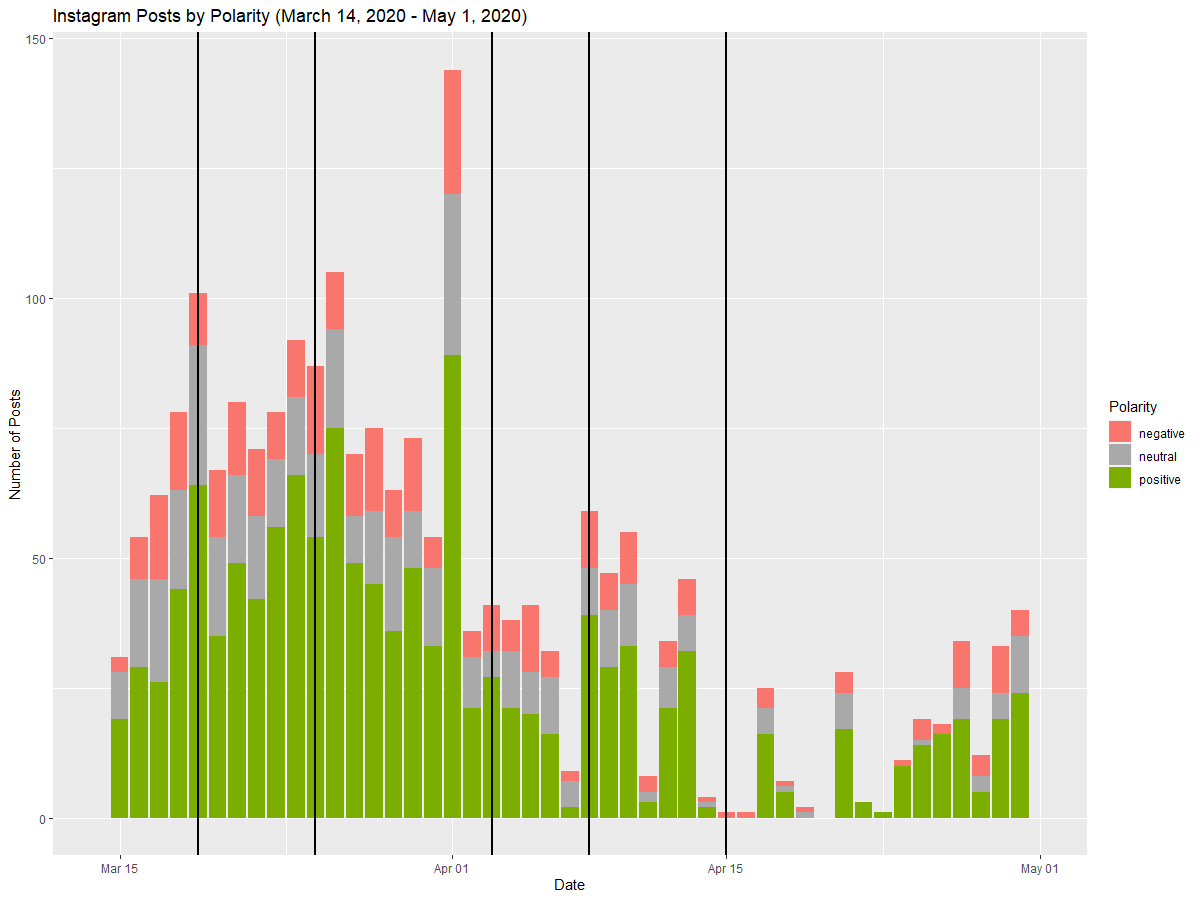
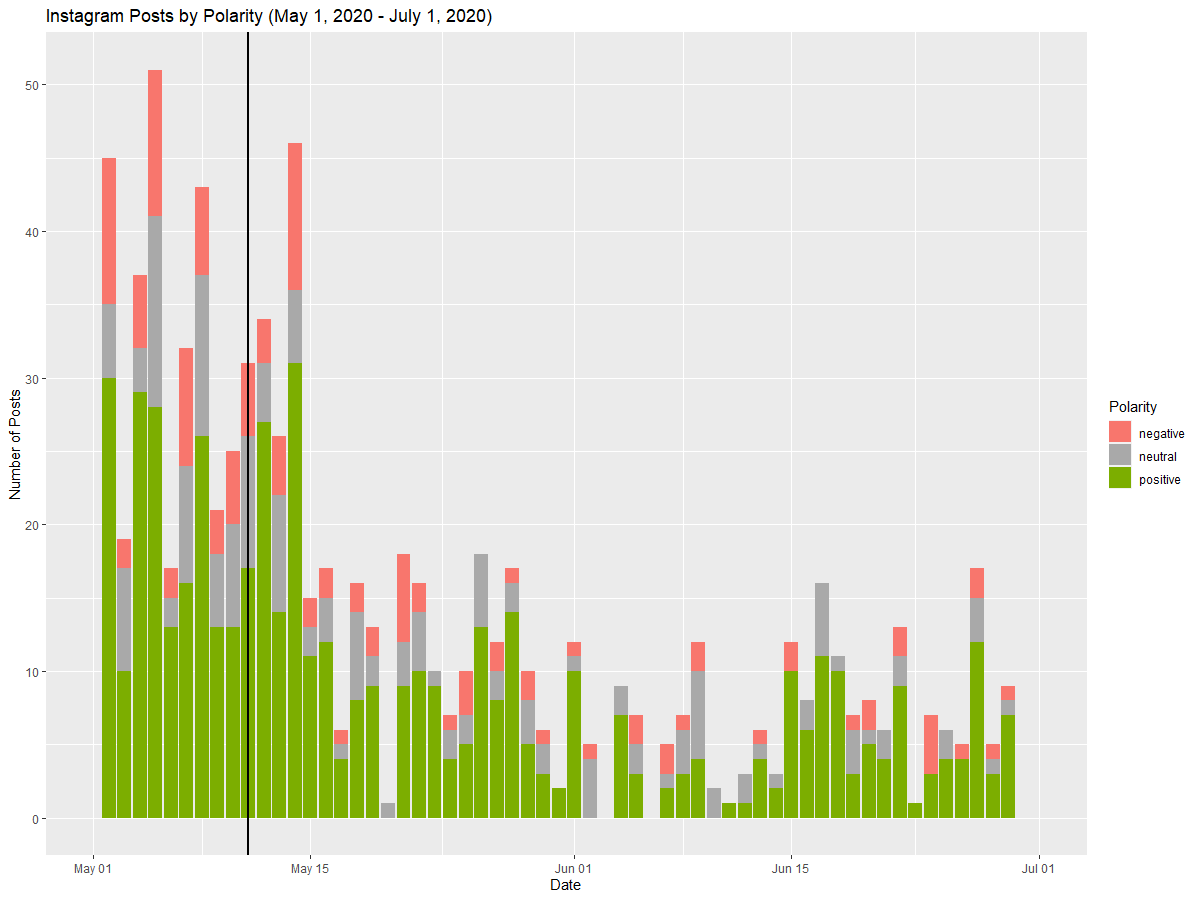
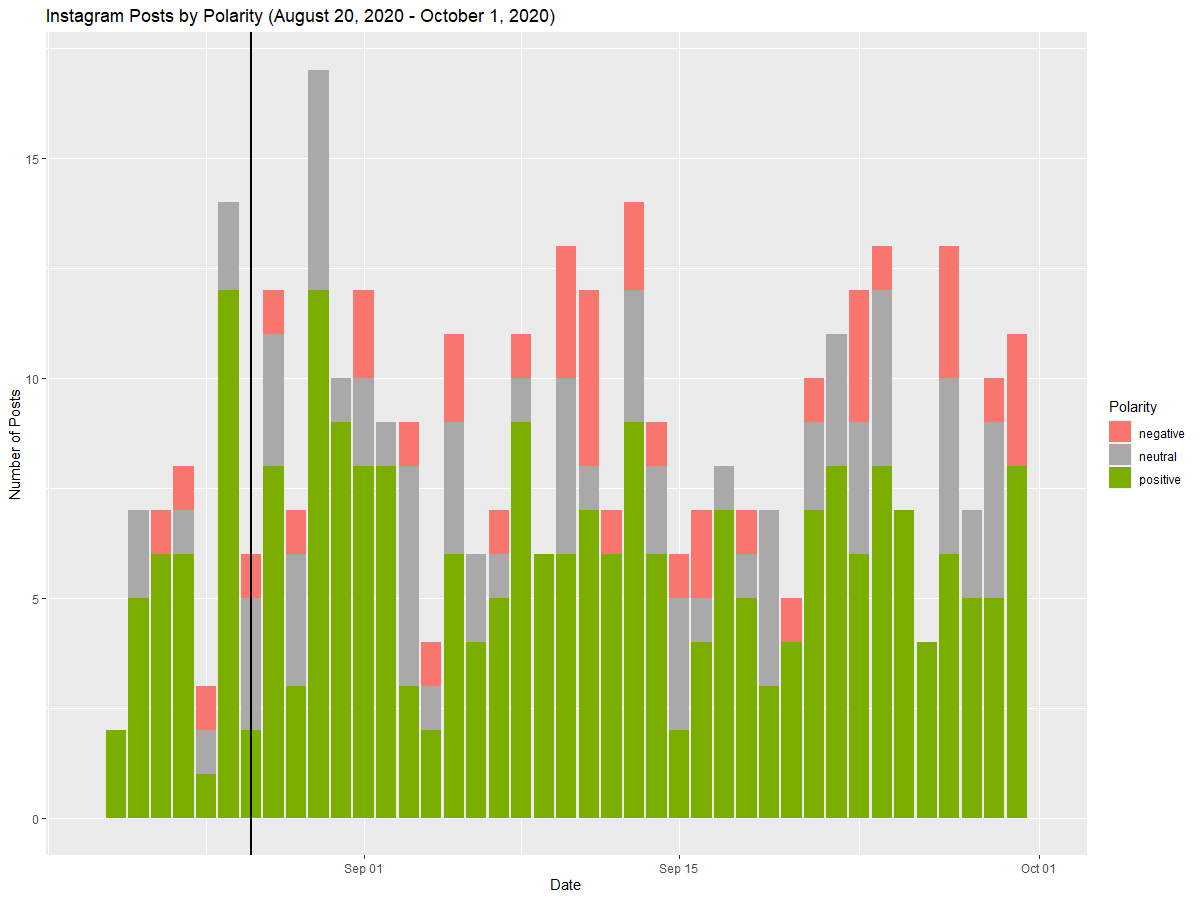
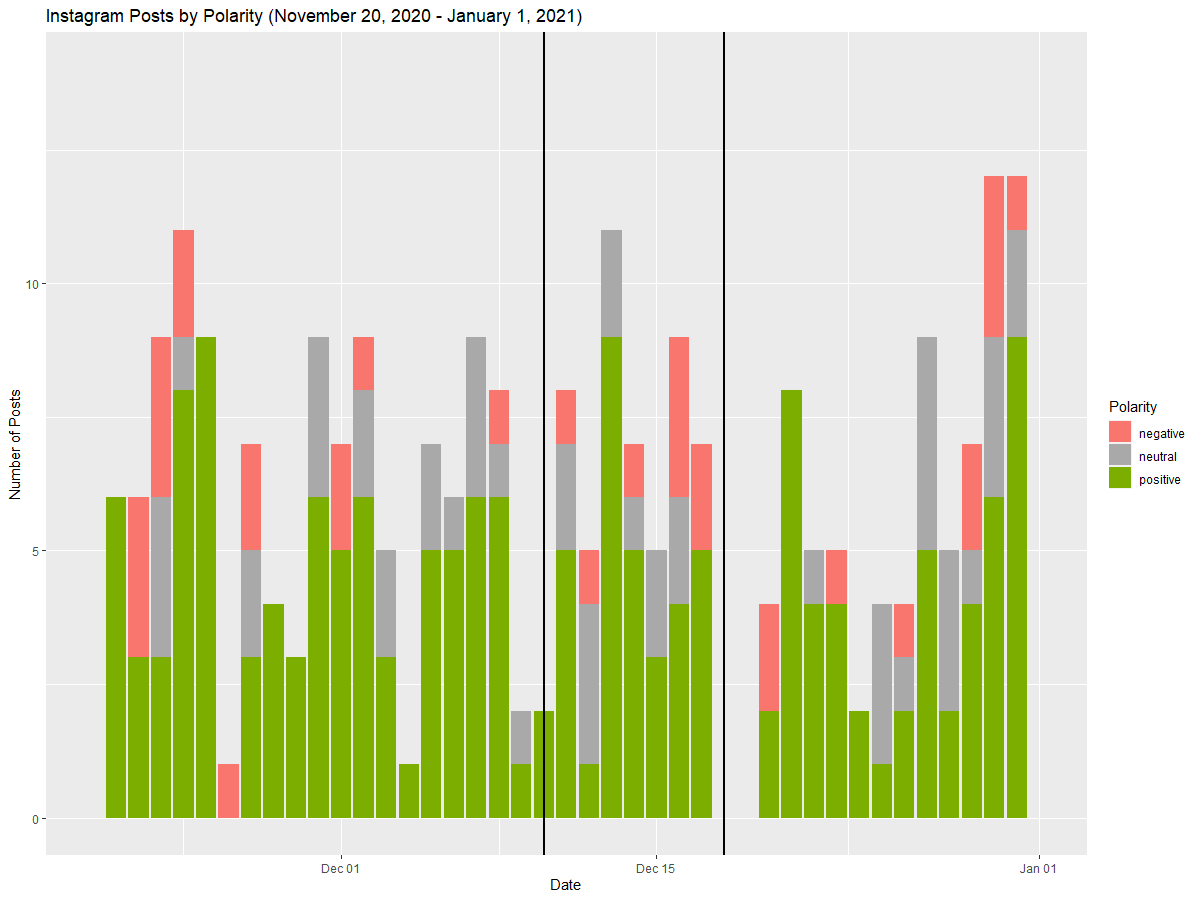
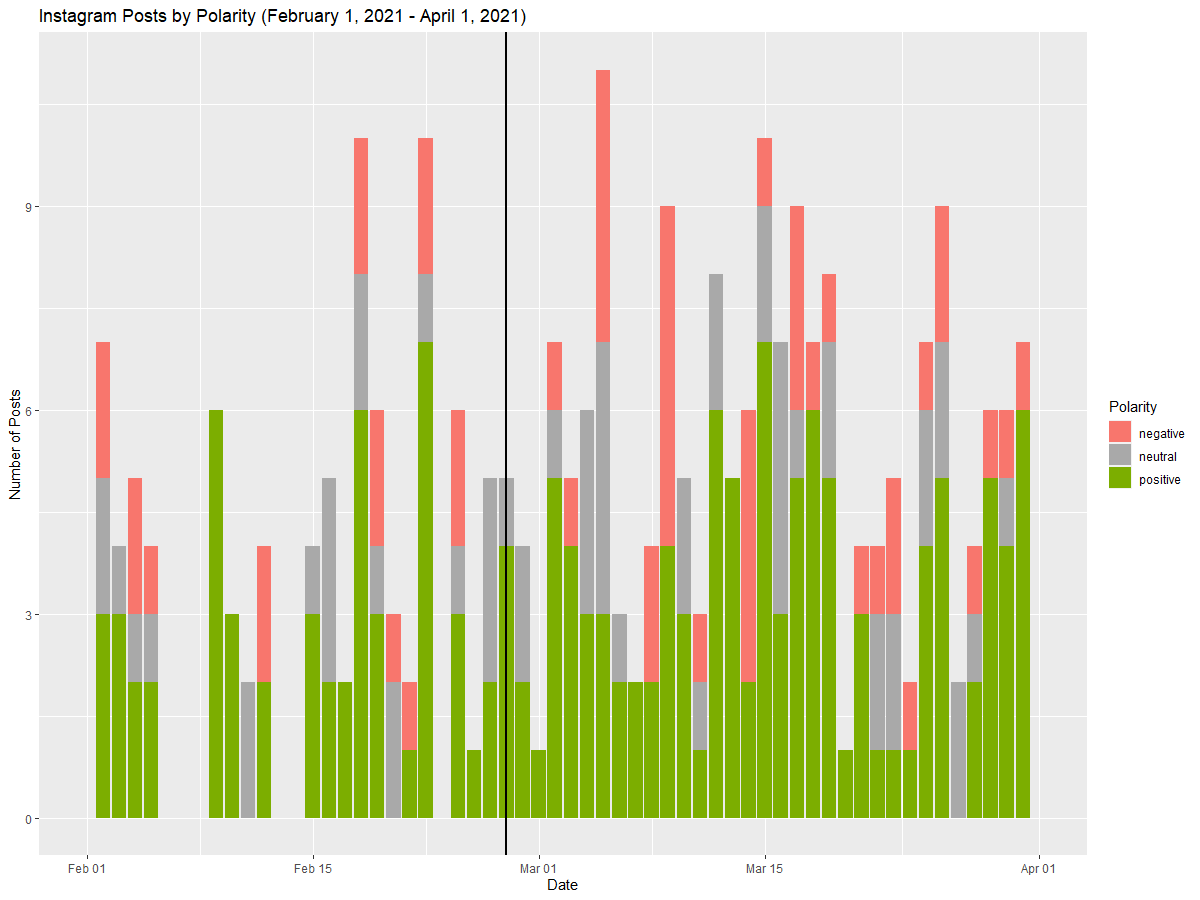
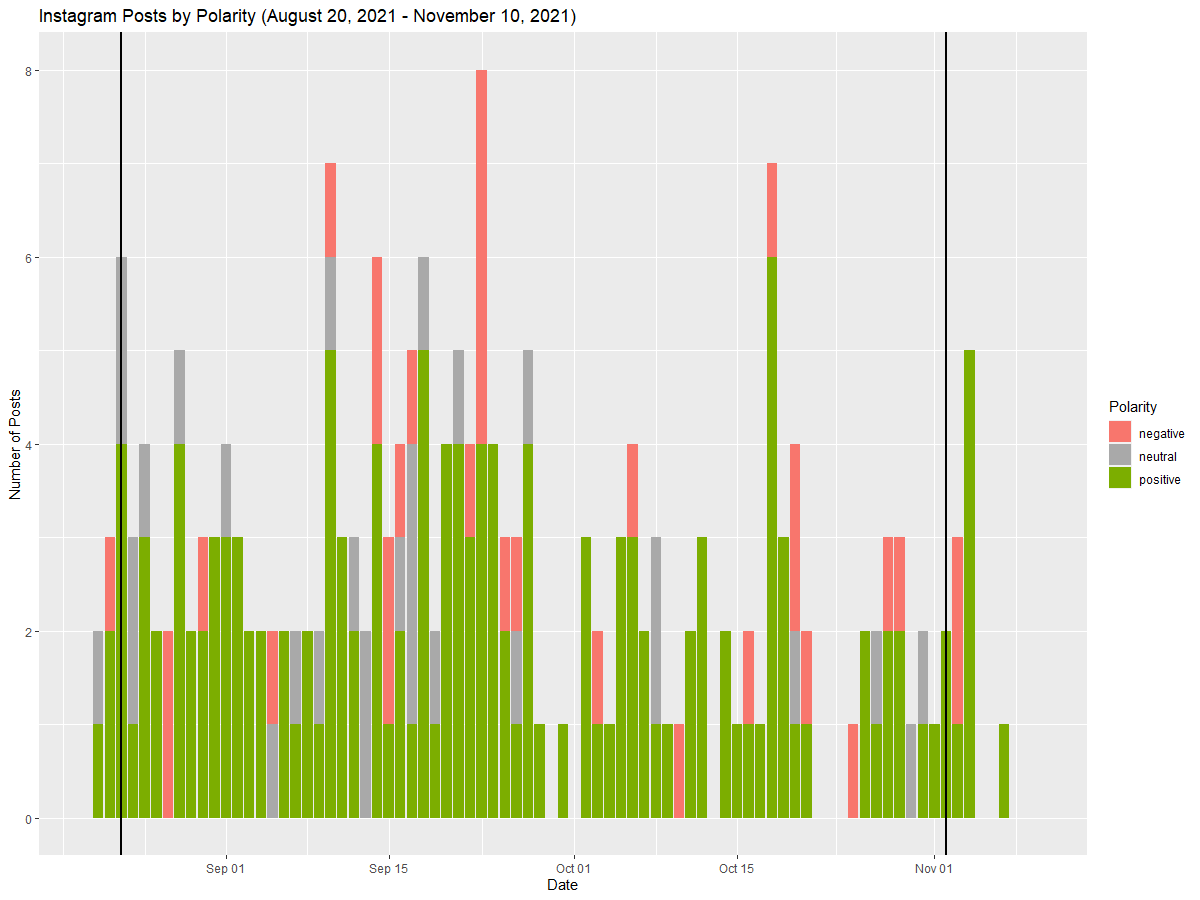
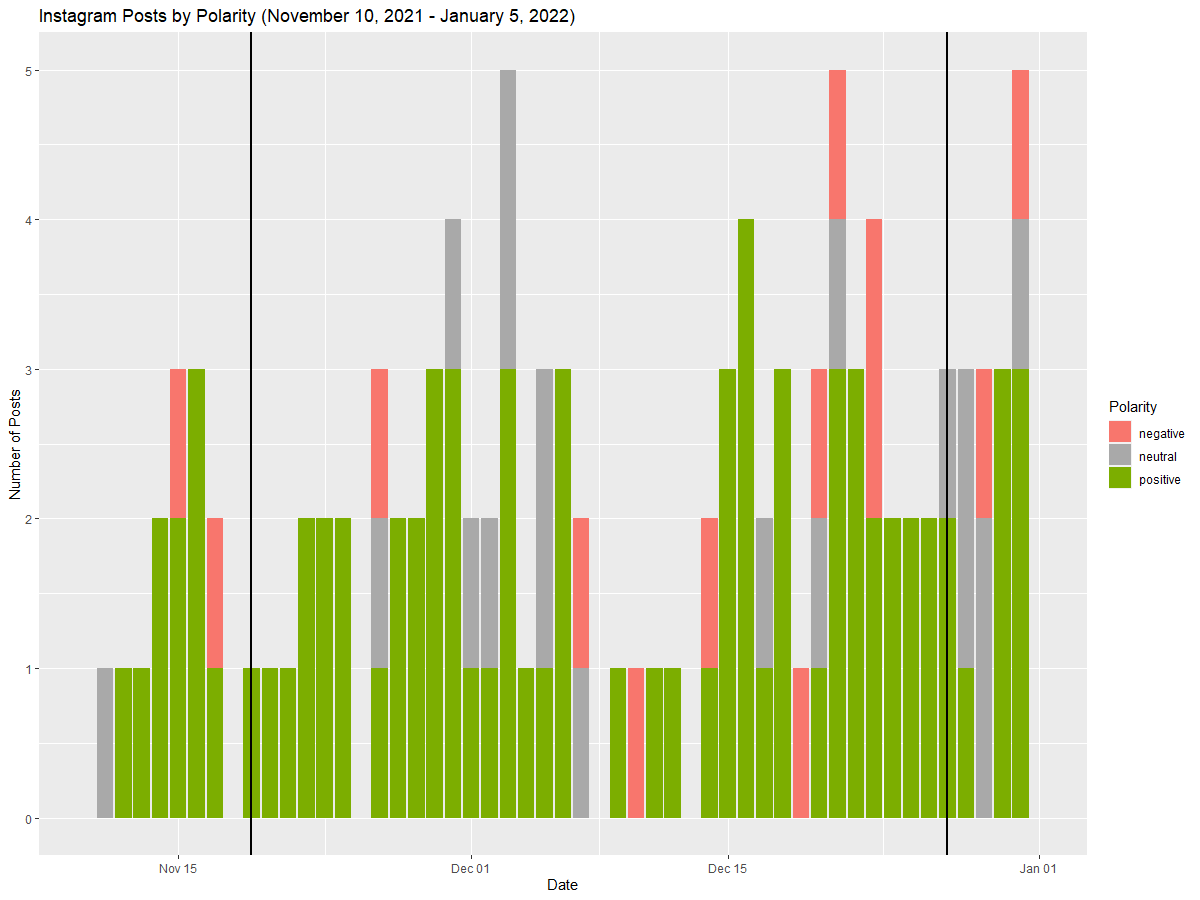
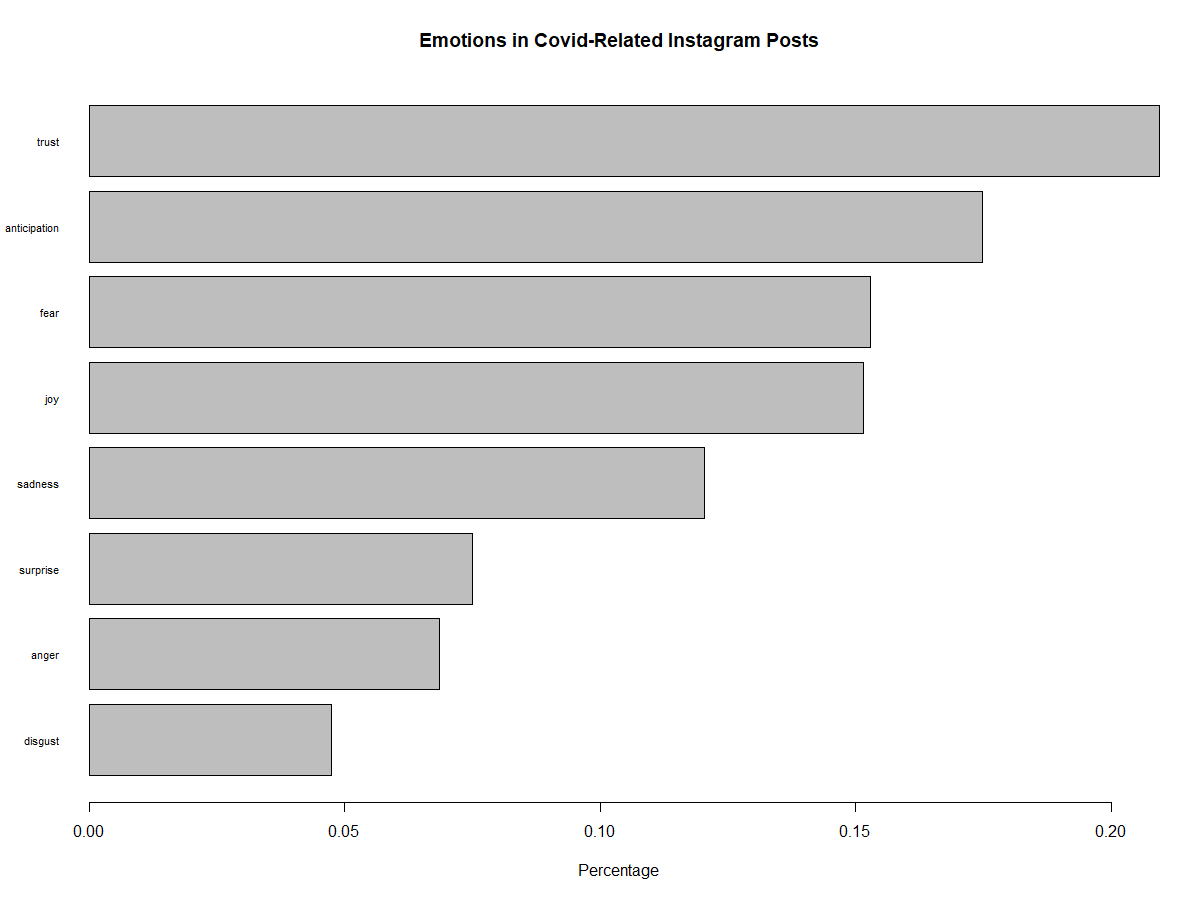
Data Visualizations
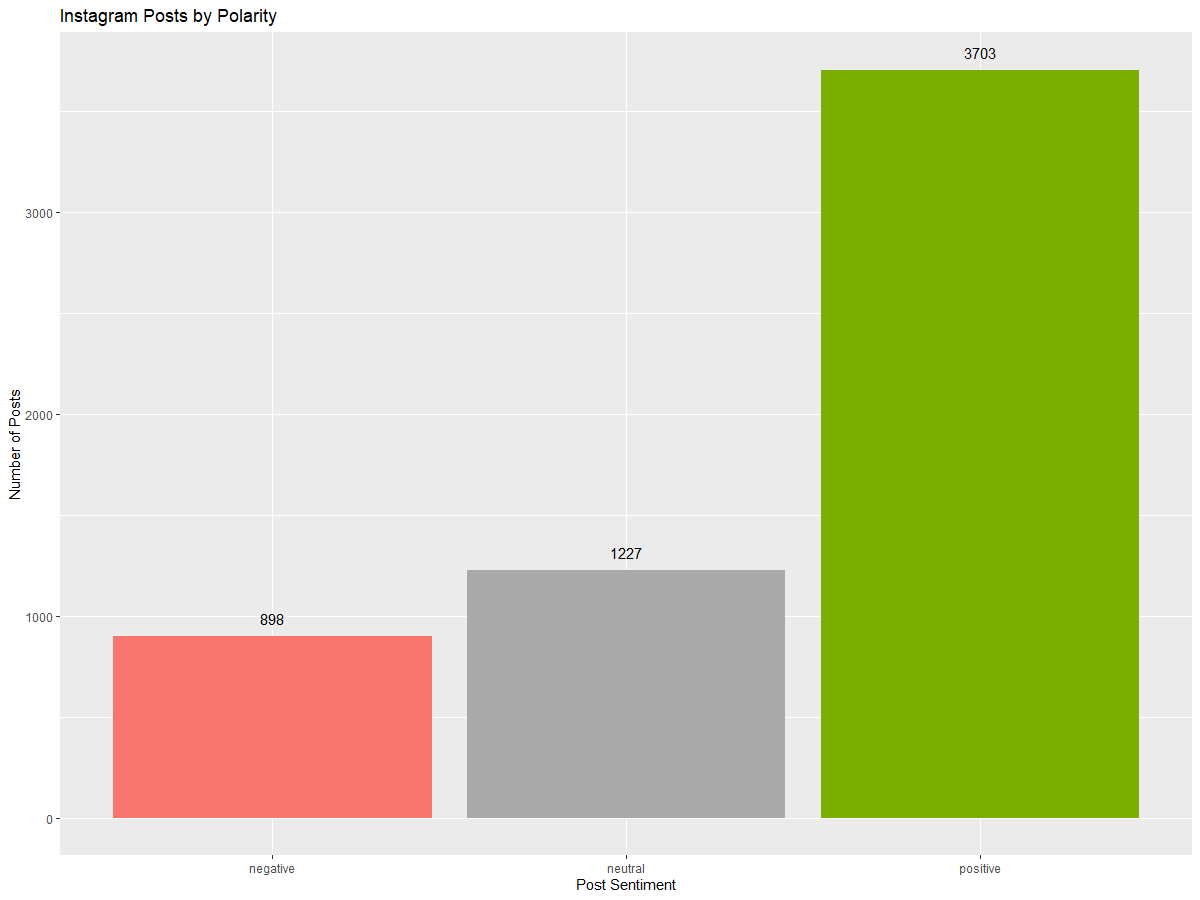
Above is a bar graph displaying the sentiment of the Instagram posts we observed. As you can see there are a large number of positive posts, which makes sense given the type of social media platform Instagram is. Instagram is a platform that is mostly used as a vehicle for highlights of the users’ life and other more lighthearted posts, because of this nature we do see many positive posts in comparison to negative and neutral ones. In contrast to the other platforms our team observed, it seems Instagram users tried to look toward the “positives” of the situation the world was facing.